
A common question type in IELTS academic writing task 1 is to describe a trend as shown on a line graph. In this article, I will teach you everything you need to know about describing trends in the past to get a high score for this question.
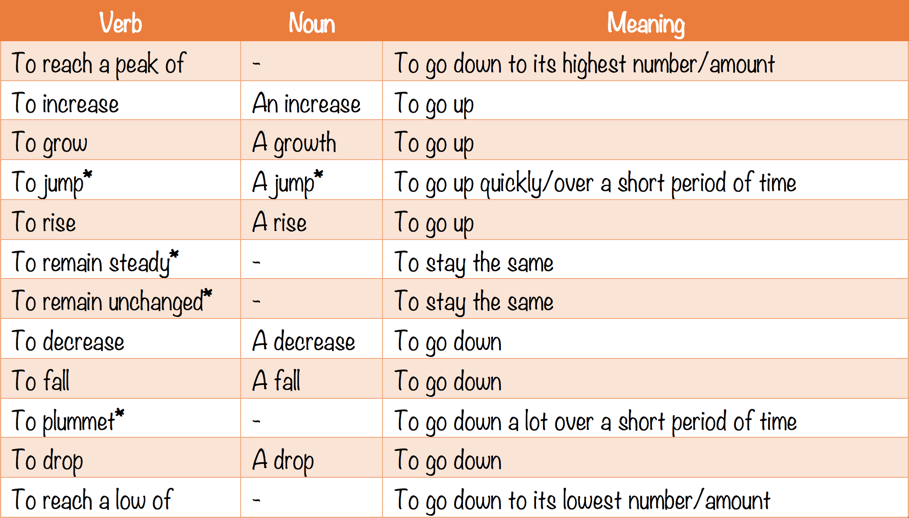
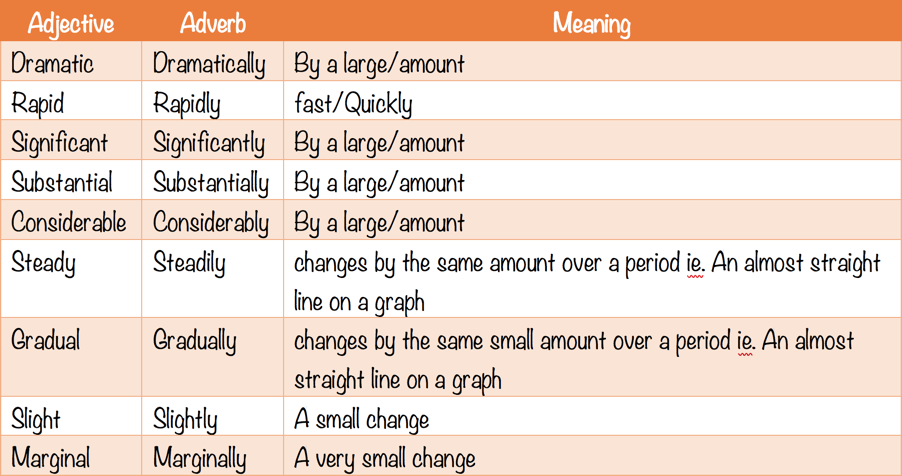
We can use this vocabulary in 3 main structures as follows.
Structure 1:
There was a + adjective + noun…
Eg. There was a rapid increase in the number of cars sold.
Structure 2:
The figure/number/amount/sales/exports/imports + verb + adverb…
Eg. The figure for cars sold increased rapidly.
Structure 3:
The figure/number/amount + experienced/witnessed + a + adjective + noun…
Eg. The number witnessed a rapid increase.
It is important to know how to use all of these structures accurately in order to avoid repetition. Look at below charts for examples of vocabulary that you can use to describe trends in IELTS writing task 1.
Let's take a look at some examples of how to use these structures to describe a line graph.
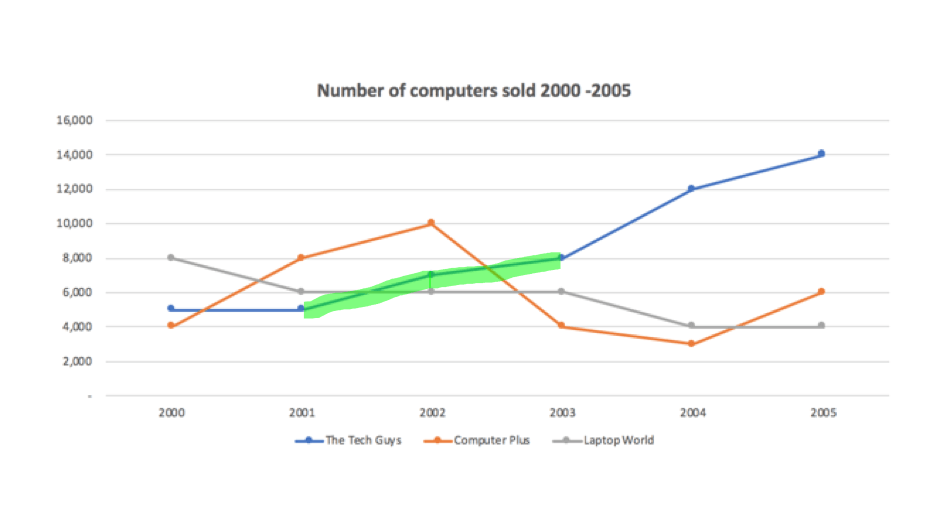
S1: There was a steady rise in the number of computers sold between 2001 and 2003.
S2: The figure increased steadily between from 2001 to 2003.
S3: The figure experienced/witnessed a steady increase between 2001 and 2003.New Paragraph
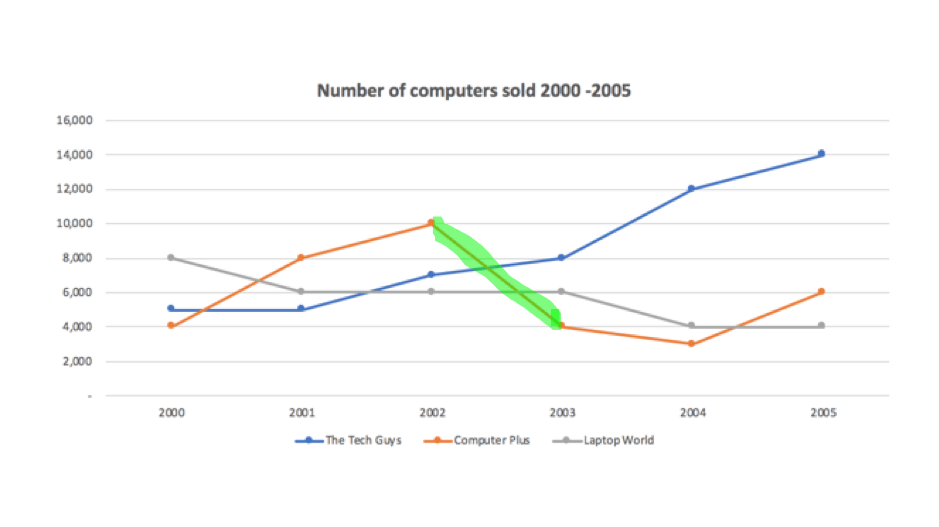
S1: There was a sharp decrease in the number of computers sold in 2003.
S2: The figure fell dramatically in 2003.
S3: The figure experienced/witnessed a rapid drop in 2003.
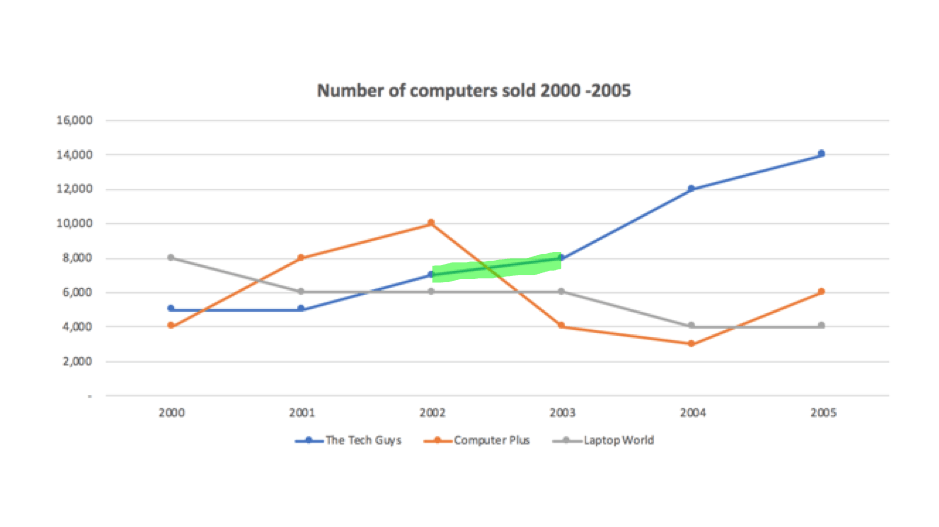
S1: There was a slight increase in the number of computers sold in 2003.
S2: The figure rose slightly in 2003.
S3: The figure experienced/witnessed a slight rise in 2003.
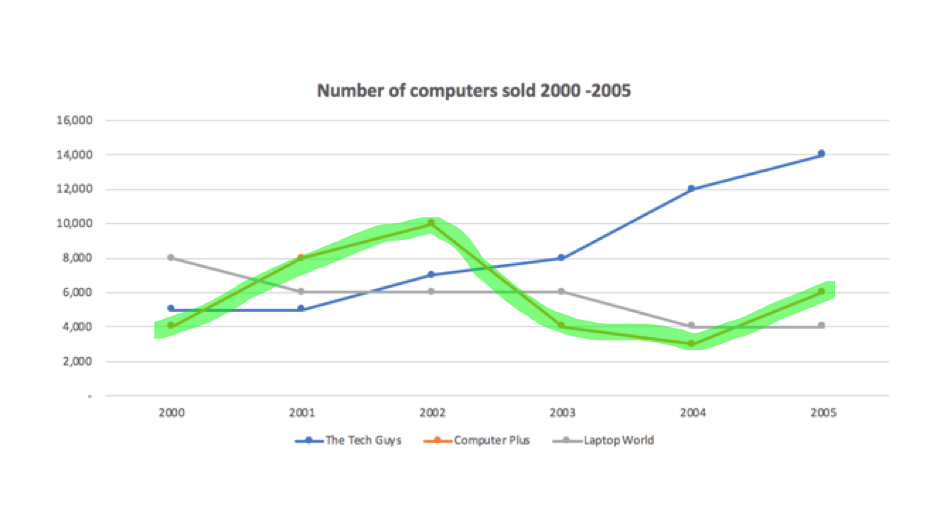
S1: There was a fluctuation in the number of computers sold in from 2000 to 2005.
S2: The figure fluctuated between 2000 and 2005.
S3: The figure experienced/witnessed a fluctuation between 2000 and 2003.
*Fluctuation/to fluctuate = to go up and down
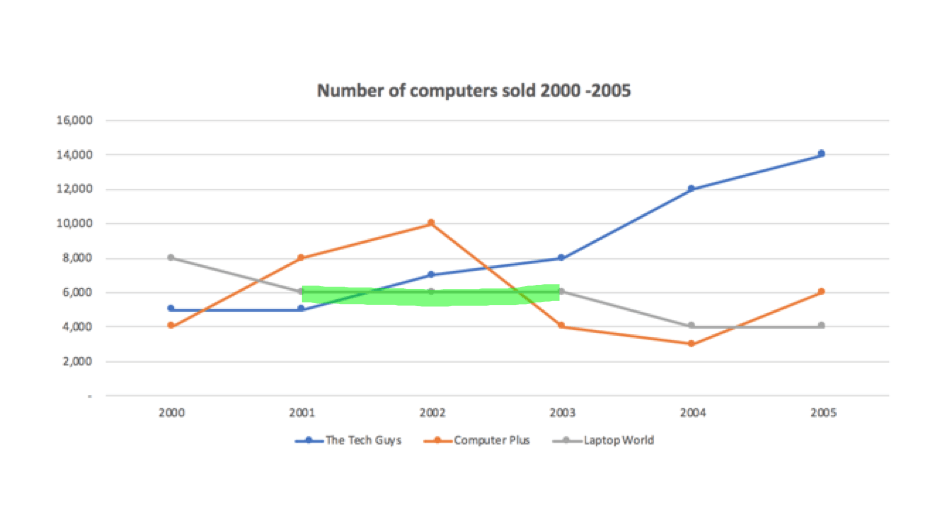
S1: The figure remained stable between 2001 and 2003.
S2: The figure remained unchanged from 2001 to 2003.
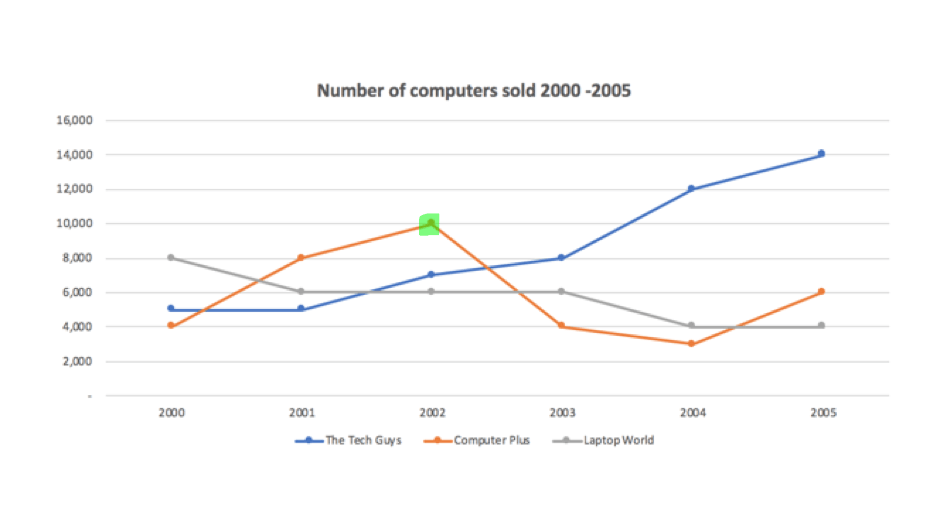
S1: The figure for Computer Plus reached a peak in 2002.
(a peak = its highest figure)
02 Structuring your trend report.
For this task, I recommend that you use 4 paragraphs that contain information as follows;
1. Introduction
- Paraphrase the question.
2. Overview
- Give summary of major movements.
- Mention highest and lowest and general direction of movement ie, increase/decrease/fluctuation.
- Do not include figures in this paragraph.
3. Detail paragraph 1
- Include figures.
- Use linking words to connect sentences. (We will look at this later in the lesson)
4. Detail paragraph 2
- Include figures.
- Use linking words to connect sentences. (We will look at this later in the lesson)
*There is no need to include a conclusion paragraph in IELTS writing task 1.
03 Exam step 1: Analyzing & Planning.
Before you plan, you need to analyze the question. Many students fail to do this and as a result make silly mistakes and lose easy marks for Task Achievement.
In this step, you should;
01 Read all parts/explanations of the diagram/chart to understand what you are looking at.
Many students fail to do this and as a result make silly mistakes and lose easy marks for Task Achievement.
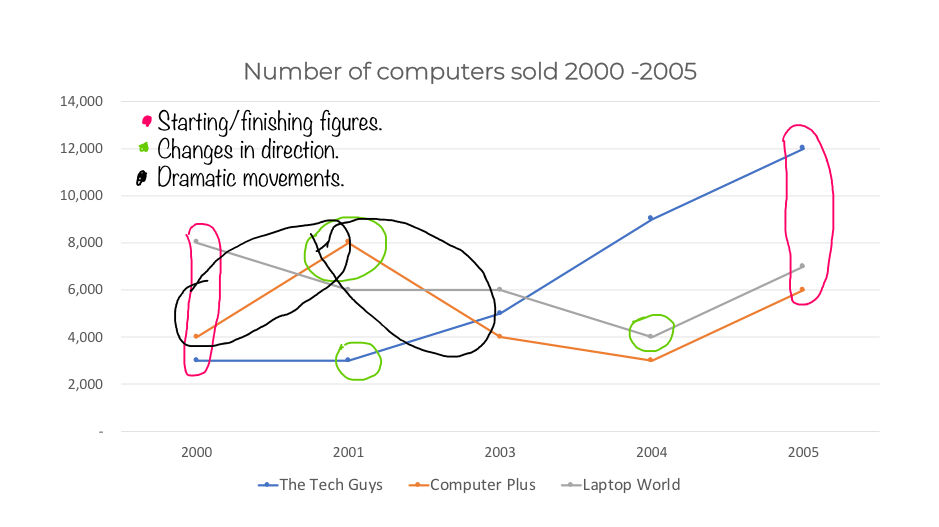
02 Identify ‘key’ or interesting features.
For trends you should look at the chart or graph and take note of.
- Starting and finishing figures for each category/group.
- Major changes in direction.
- Large/dramatic movements.
- Highest/lowest figures.
For example.
04 Exam step 2: Paraphrasing the question.
In order to get a high score in IELTS writing you must show the examiner your ability to paraphrase. You can use synonyms to paraphrase the question but make sure you are 100% correct. Many students paraphrase incorrectly making their writing difficult to understand and often inaccurate. You should not aim to use ‘high level’ words here. Simply, use synonyms and/or change the grammatical structure of the sentence.
Let’s take a look at an example of how we might do this.
Original question
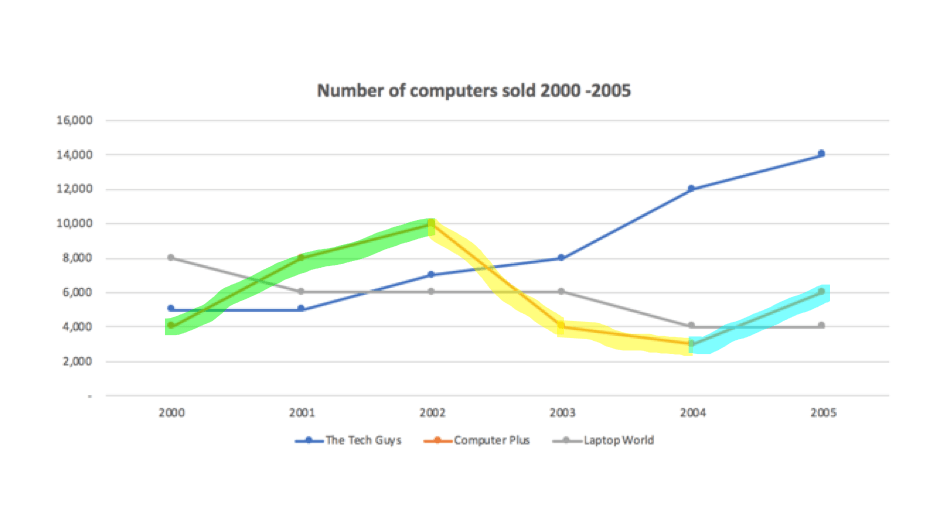
The chart below shows the number of computers sold at three computer stores in Ho Chi Minh City between 2000 and 2005.
Introduction line (paraphrased question)
The line graph illustrates/depicts how many books were sold from 2000 to 2005 at three computer shops located in Ho Chi Minh City.
Below are some useful synonyms that you can use to paraphrase the question.
- Graph/Line graph/Chart/Table/Bar chart – Diagram
- Shows – illustrates – depicts
- The number of – how many
- The amount of – how much
- From 2000 to 2005 – between 2000 and 2005
- Shop – store
- In – located in
05 Exam step 3: Writing an overview.
The overview should come after the introduction line. In this paragraph, you should do the following.
- Give a summary of major movements.
- Mention highest and general direction of movements ie, increase/decrease/fluctuation.
*Do not include figures in this paragraph.
Take a look at the below example.

Overview Example
Overall, the figure at The Tech Guys rose steadily and accounted for the highest sales during the period, peaking in 2005. In contrast, sales at Laptop Plus, which had the lowest sales of the three stores, decreased considerably while figures at Computer Plus fluctuated over the period.
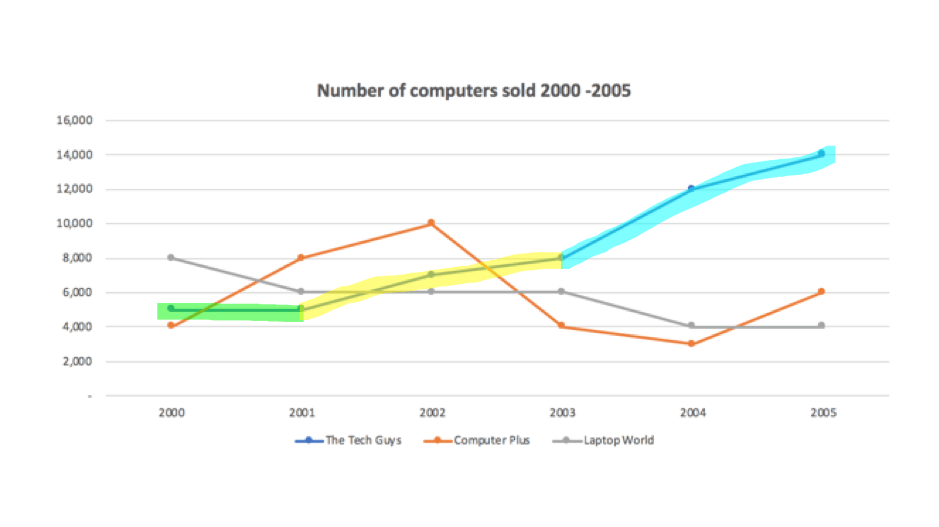
06 Exam step 4: Writing body paragraphs.
In order to get a high score in IELTS writing task 1 your writing needs to flow(progress naturally) and include some complex sentences. To create a flow in your report, you should use some linking words like ‘following this’ or ‘then’ to describe when something happened. You should also use linking words to compare like ‘similarly’ or ‘On the other hand’. If you’re not familiar with complex sentences, it is a good idea to check out our lesson on them here.
‘Before’ and ‘after’ are very useful for describing trends and along with some linking words can help you to group information and maintain a natural flow in your writing. Previously in this lesson, we looked at some vocabulary and structures to use.
Now take a look at the below examples in which I group information paying attention to the key or interesting features we identified in the analyzing and planning stage.
07 Sample Answer
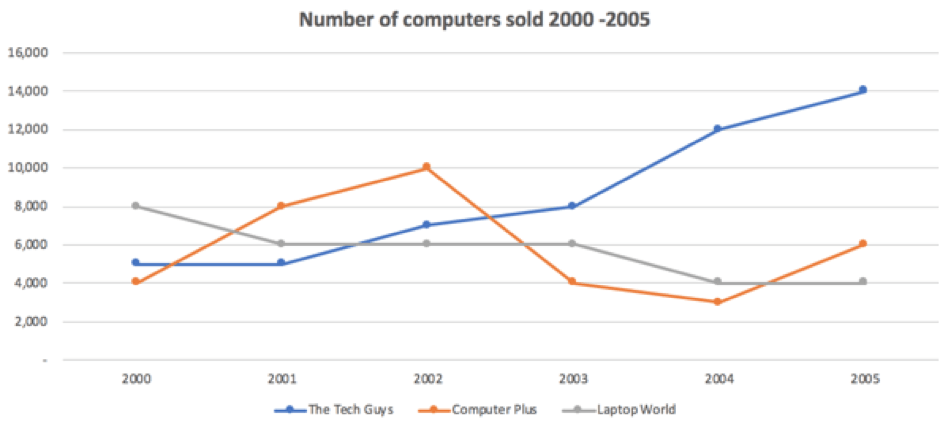
The chart below shows the number of computers sold at three computer stores in Ho Chi Minh City between 2000 and 2005.
Summarise the information by selecting and reporting the main features and make comparisons where relevant.
Sample Answer
Overall, the figure at The Tech Guys rose steadily and accounted for the highest sales during the period, peaking in 2005. In contrast, sales at Laptop Plus, which had the lowest sales of the three stores, decreased considerably while figures at Computer Plus fluctuated over the period.
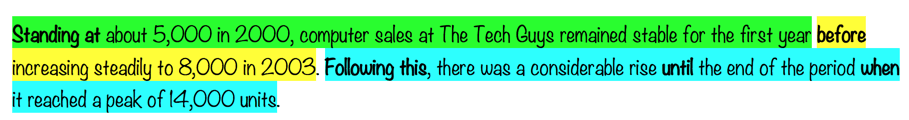
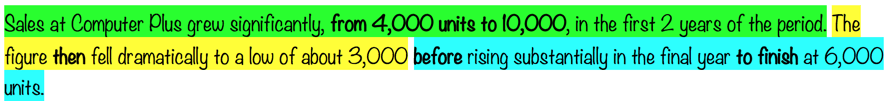
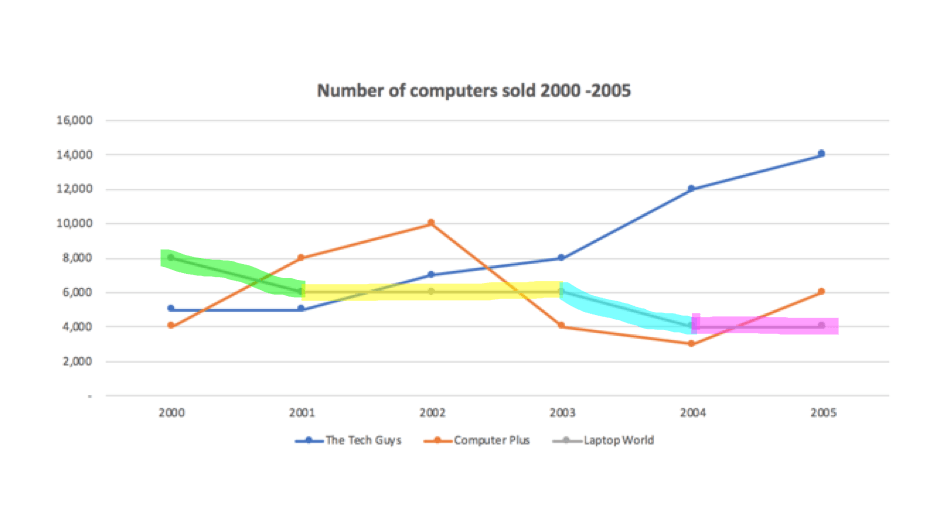
Standing at about 5,000 in 2000, computer sales at The Tech Guys remained stable for the first year before increasing steadily to 8,000 in 2003. Following this, there was a considerable rise until the end of the period when it reached a peak of 14,000 units. Sales at Computer Plus grew significantly, from 4,000 units to 10,000, in the first 2 years of the period. The figure then fell dramatically to a low of about 3,000 before rising substantially in the final year to finish at 6,000 units.
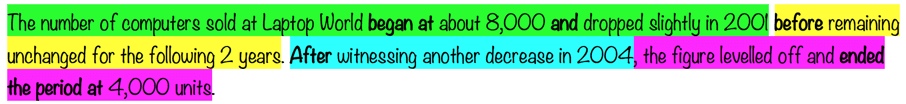
On the other hand, the number of computers sold at Laptop World began at about 8,000, and dropped slightly in 2001 before remaining unchanged for the following 2 years. After witnessing another decrease in 2004, the figure levelled off and ended the period at 4,000 units.
(204 words)
I hope you found this useful for your IELTS preparation. If you any questions, please put them in the comments below. If you liked this lesson you can see more of our lessons a the link below. Don't forget to subscribe so that you don't miss out on new lessons!